
How we Understand our Archives in the Age of LLMs
An opinionated thesis & experimental implementation of visual “deep research” tool for semantic, geographic and temporal thinking in archives + Thoughts on use cases and practical value

Introduction: Why Understand Archives? Why or why not LLMs?
In the past year, this space has explored and documented a practice of archiving articles, papers, images and links around topics of history, permaculture, and (more recently) psychology. Even before that, we created a bit of value by indexing machine learning papers as amateur learners in the space, serving a reading list with the community to learn, share and build more knowledge on. Prior still, I had a harmless yet insightful addiction to saving links in tools like Pocket (RIP), where the vast majority of my reading list went disregarded (so much so that I didn’t bother migrating off the tool when Mozilla sunsetted it) – this has been replaced by a more intentional practice with Are.na. Through these, it was clear that it’d be a great exercise to read and understand the insights of the many links in archives in aggregate, given that one couldn’t otherwise read and synthesize every single page. Pertinently, the intentional archival practice is focused towards long-term goals of the Surulere.dev project, and syntheses of the perspectives we examine is a key value of our research project. I believe that this sort of exploratory research and pattern matching is common in other projects and institutions concerned with literature review, comparative analysis and digital humanities.
Archiving with Are.na

Connected knowledge collection with community: inspirations and practices for archival
Even as LLMs came on the scene, I’ve persistently imagined ways to project the narrative text of the archives onto visual reference frames – not unlike how numeric or statistical signals can be projected onto graphs – to help visually understand correlations, come to conclusions, or at least find good places to start reading with a coherent path through the archives. Generally speaking LLMs, when thought of as a function, translate text to text of varying length — attempting to predict the next tokens, based on statistical projections of likely relation from a vast set of trained high-dimensional vector-representations of words. These vectors may by dimensionally-reduced and projected visually in 2 or 3D, whereas neighbor distance and vector direction signify semantic relationships from the LLMs’ perspective. Thinking about this more, it seemed compelling to capitalize on such visual projection of the information encoded in text, to support users to map the latent space of conclusions that an LLM could draw, rather than generating an opaque and fixed conclusion. This is partly exemplified in tools like logprobs and TokenProbe, that guide interpretability by showing the model’s confidence in each word, and the alternatives considered.
Expanding this concept to the visual interpretability of retrieval-augmented generation with LLMs, offers an automatic knowledge graph to help us understand the archives. This humanizes the same mechanisms used by LLMs, leaning on heuristics that appeal to visual & linear thinking styles, to aid understanding. Considering other visual projections of archival data that aid understanding, the idea of using timelines and maps to project the topics of interest seemed intuitive to me as a history and geography nerd.
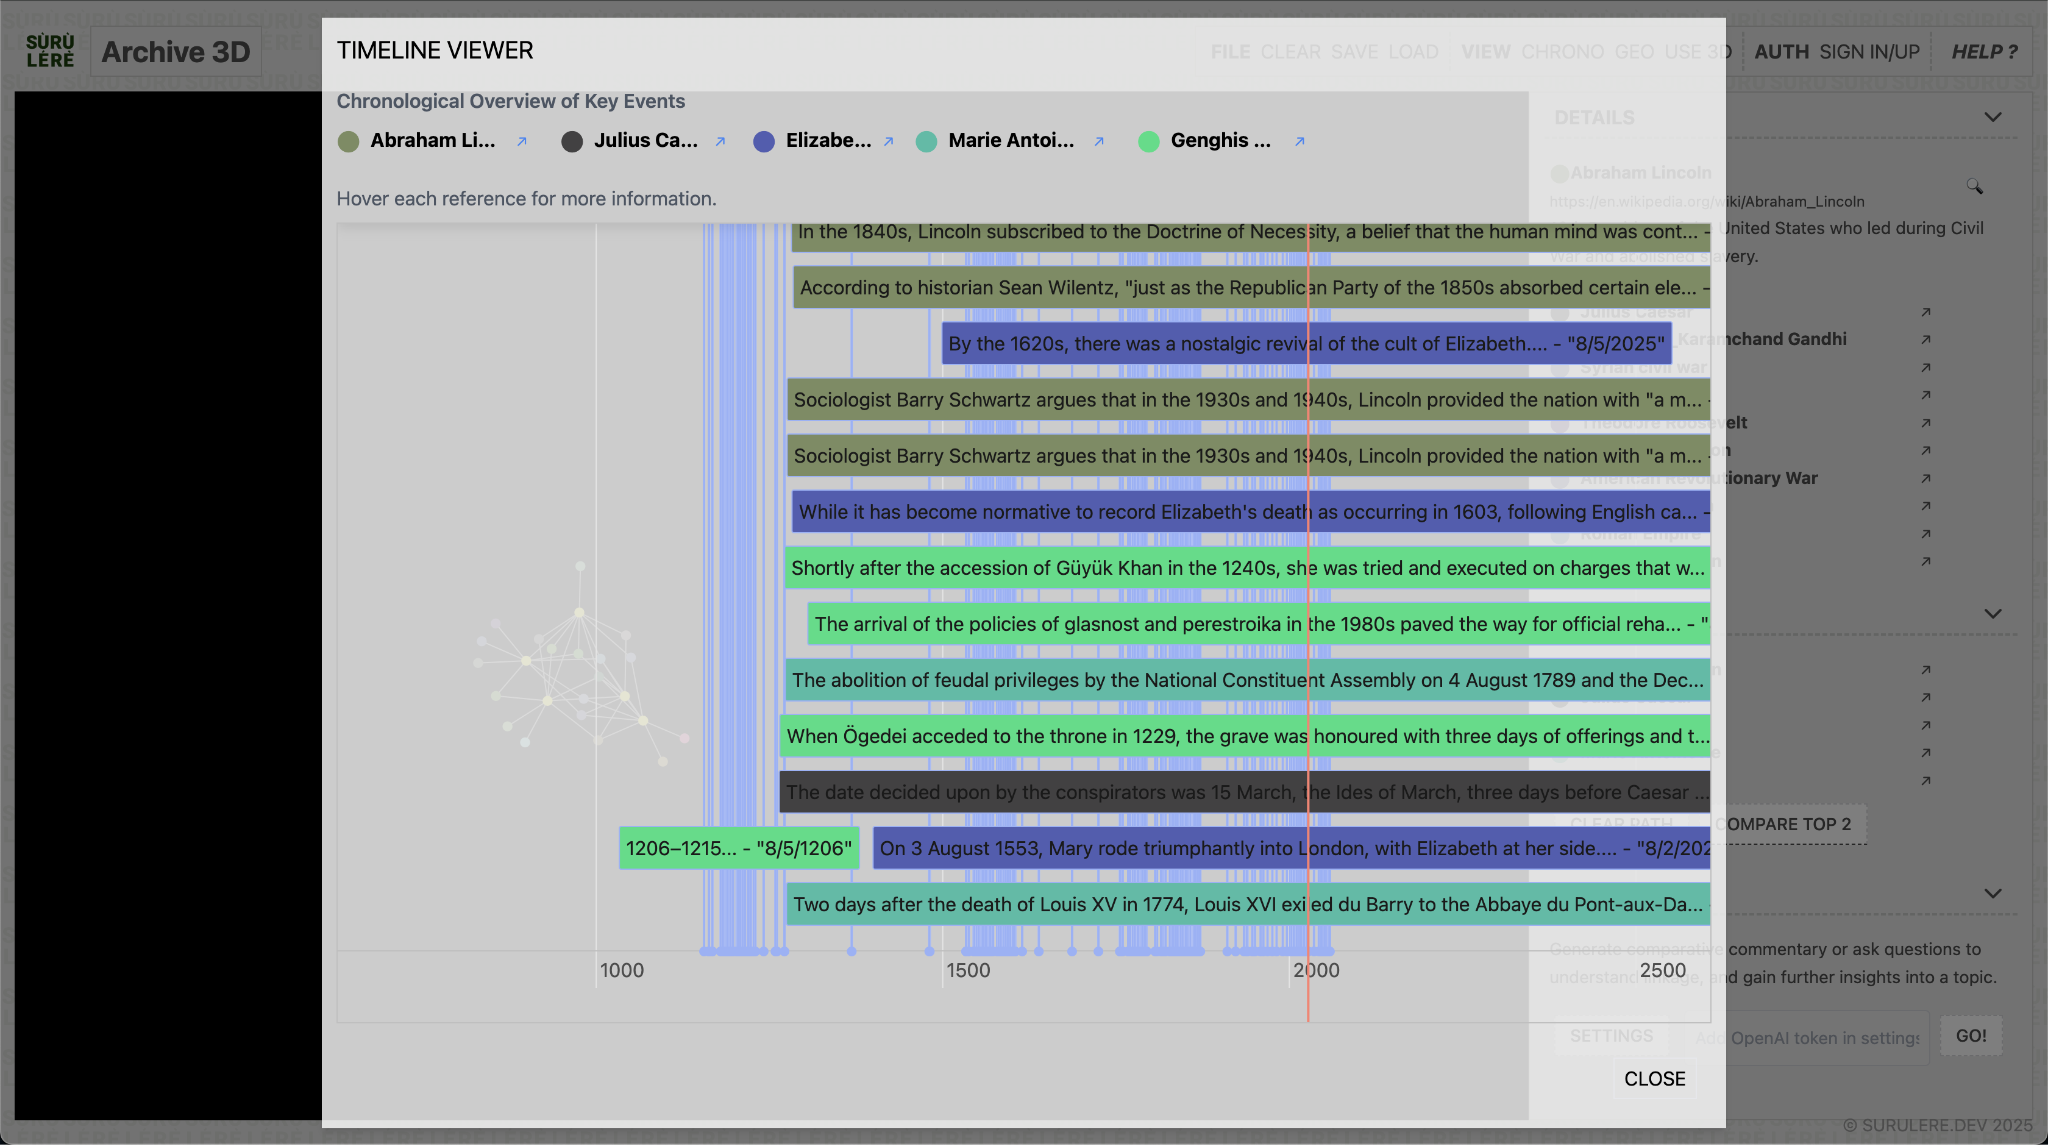
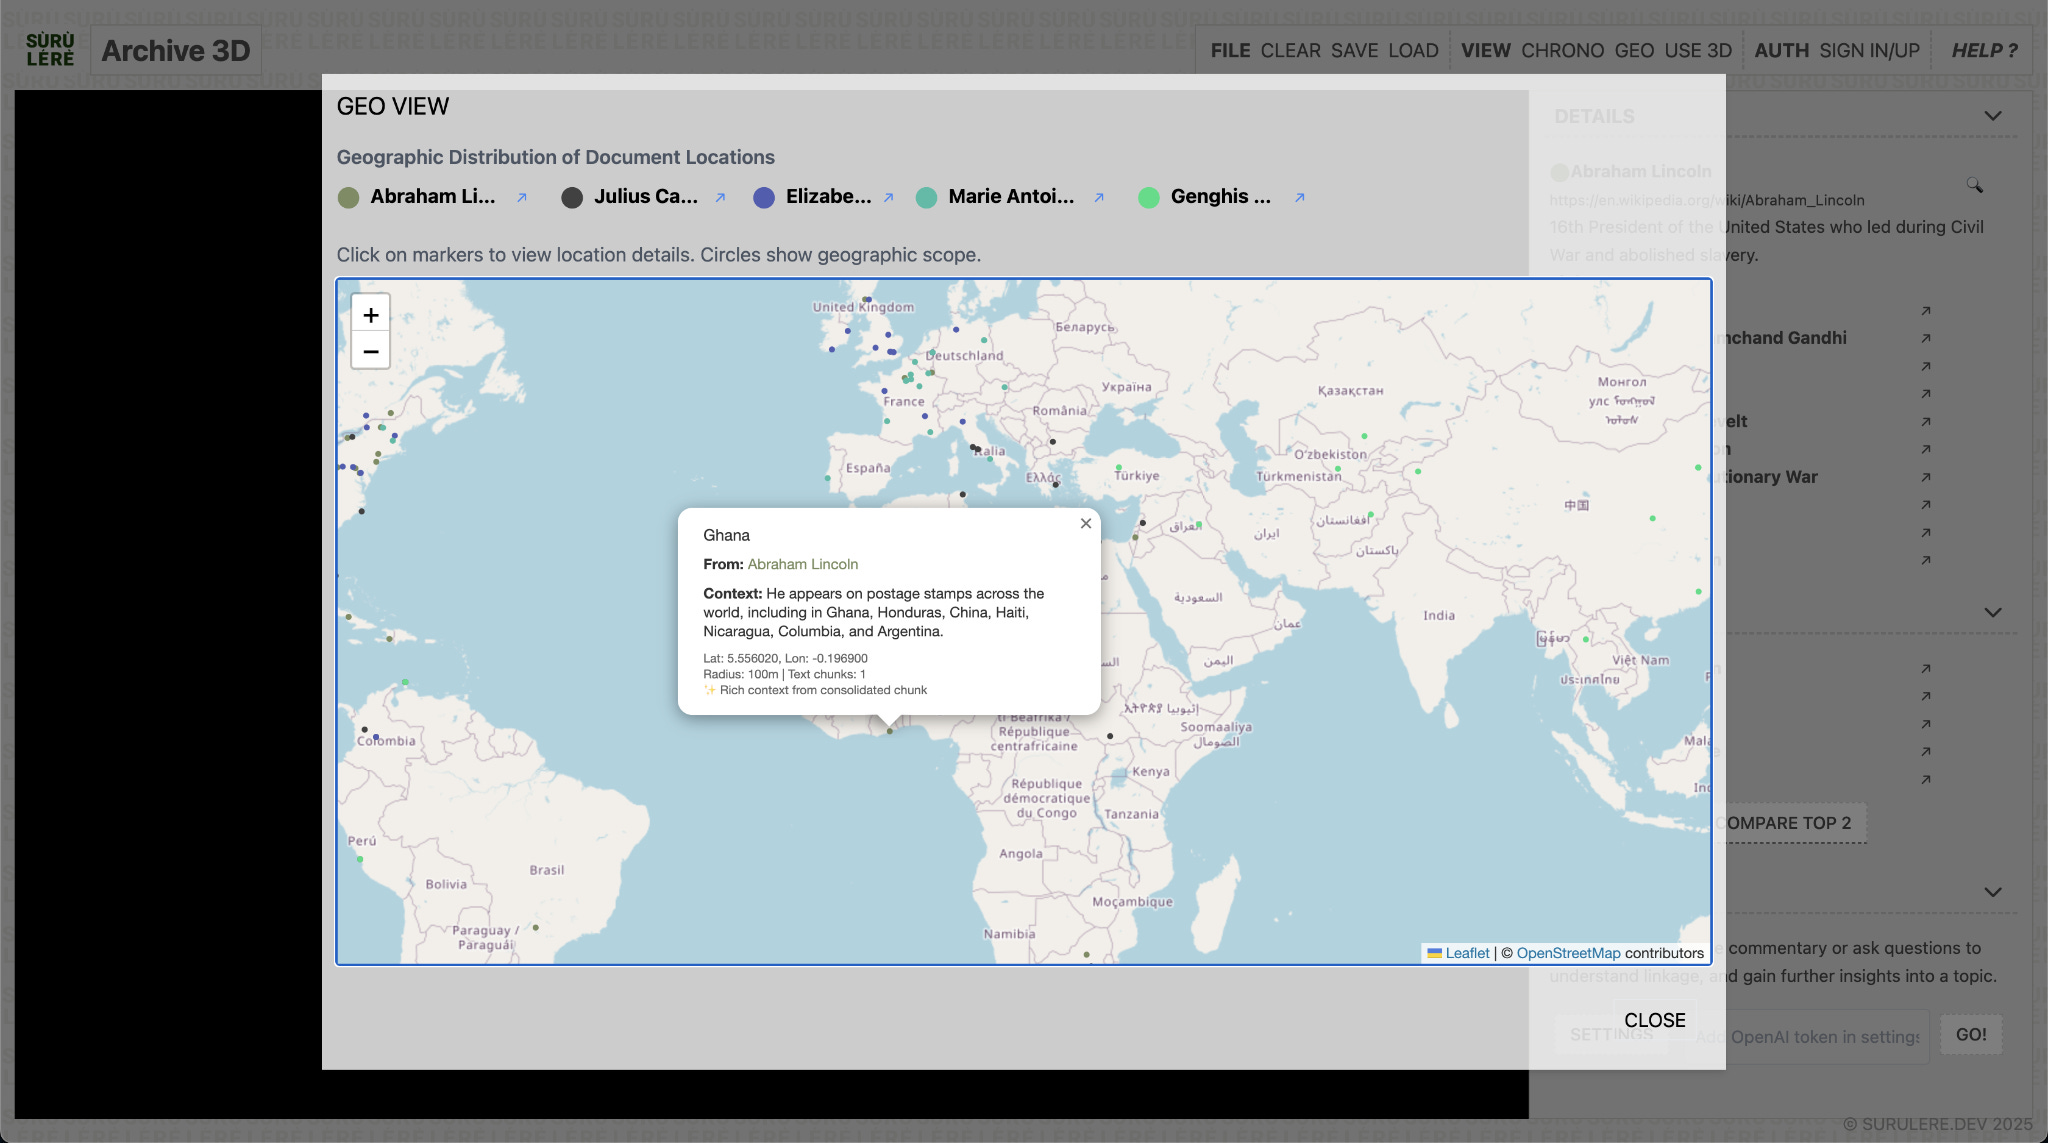
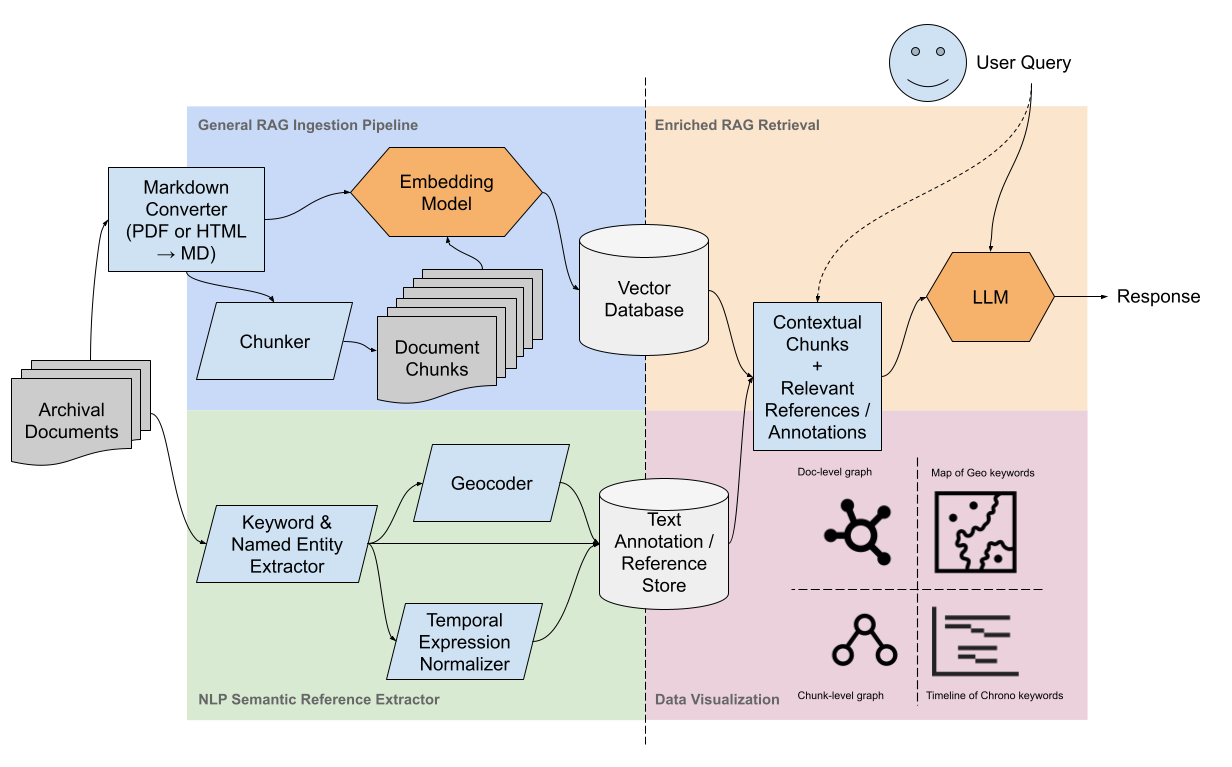
So I built this, in the form of the Archive 3D: a tool for comparative analysis of archival and historical corpora, using visualizations of semantic, temporal/chronological and spatial/geographic entities across texts.
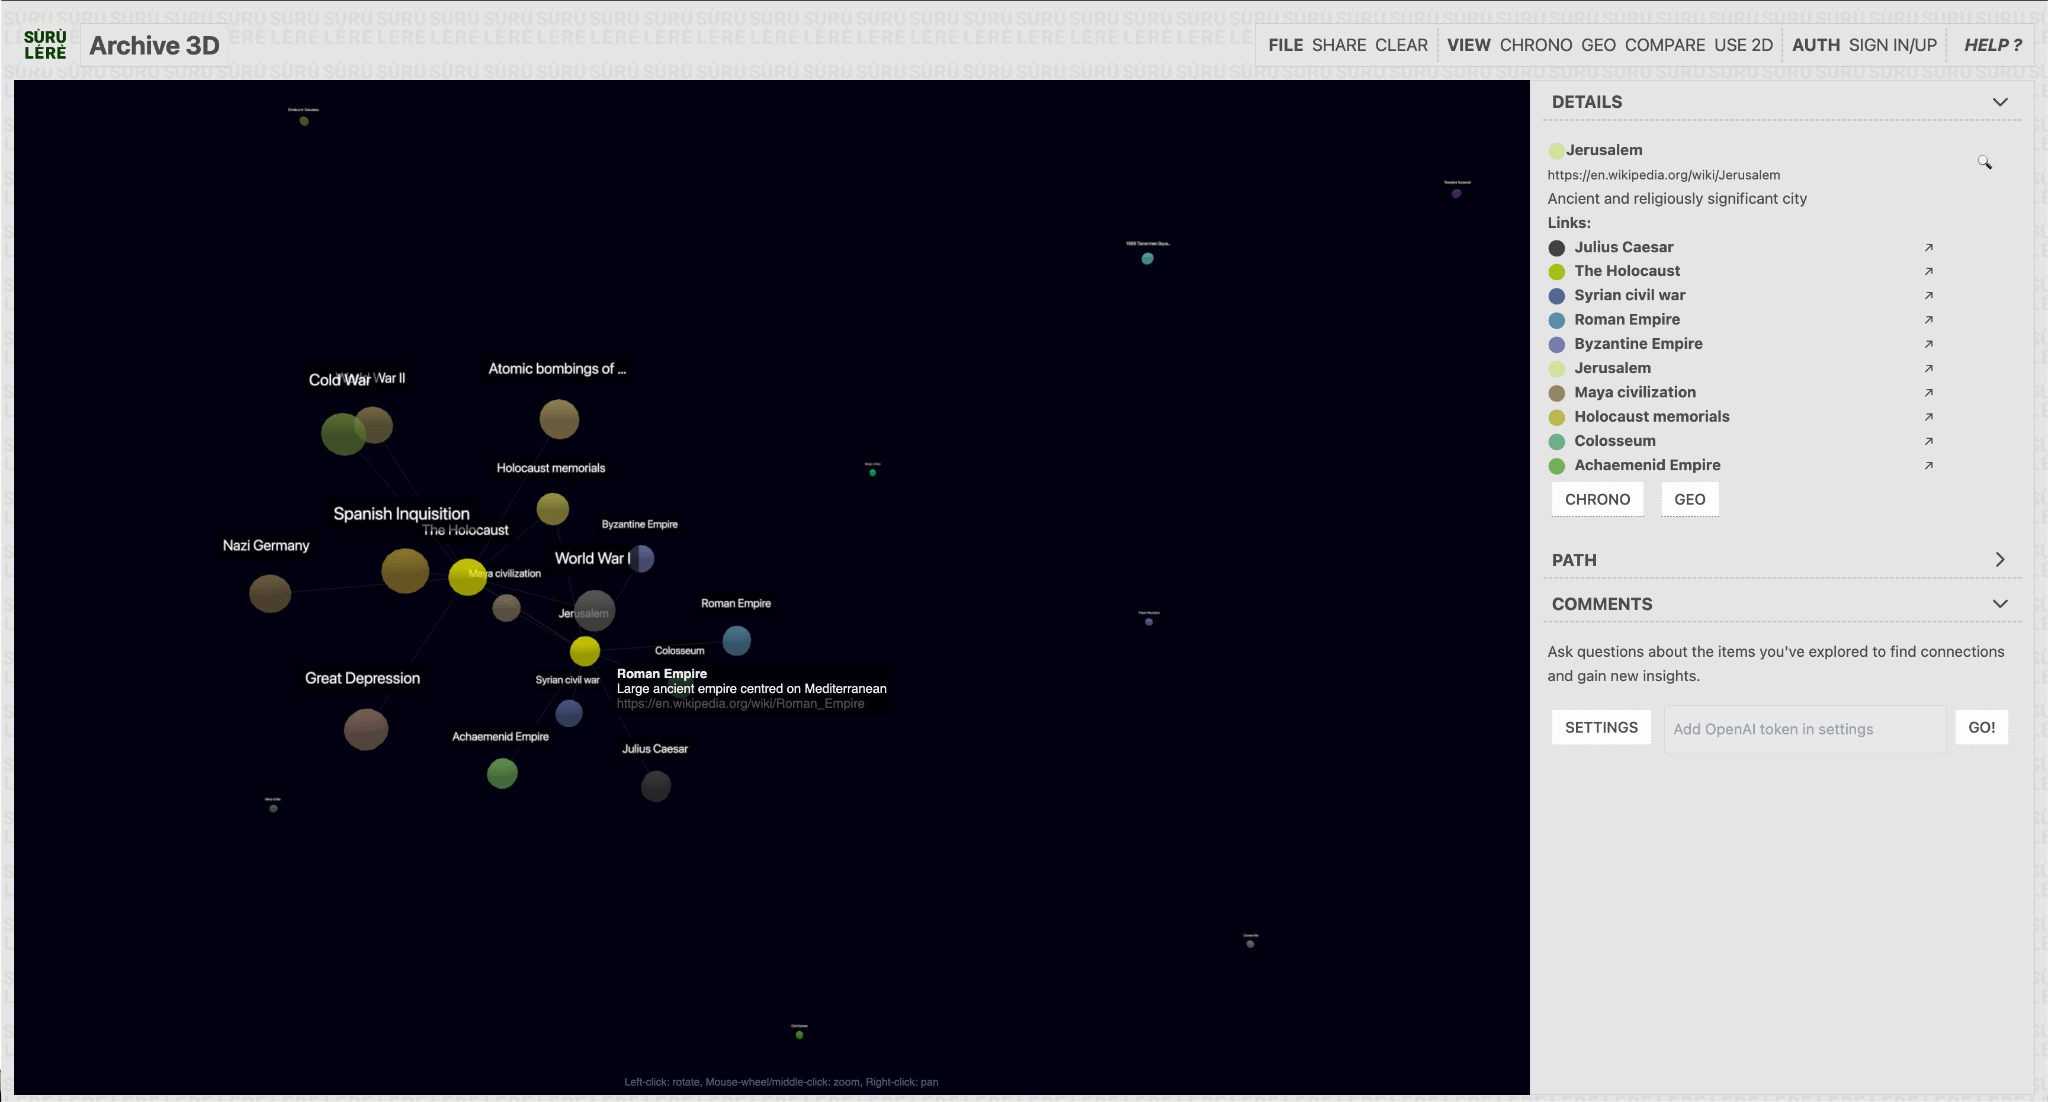
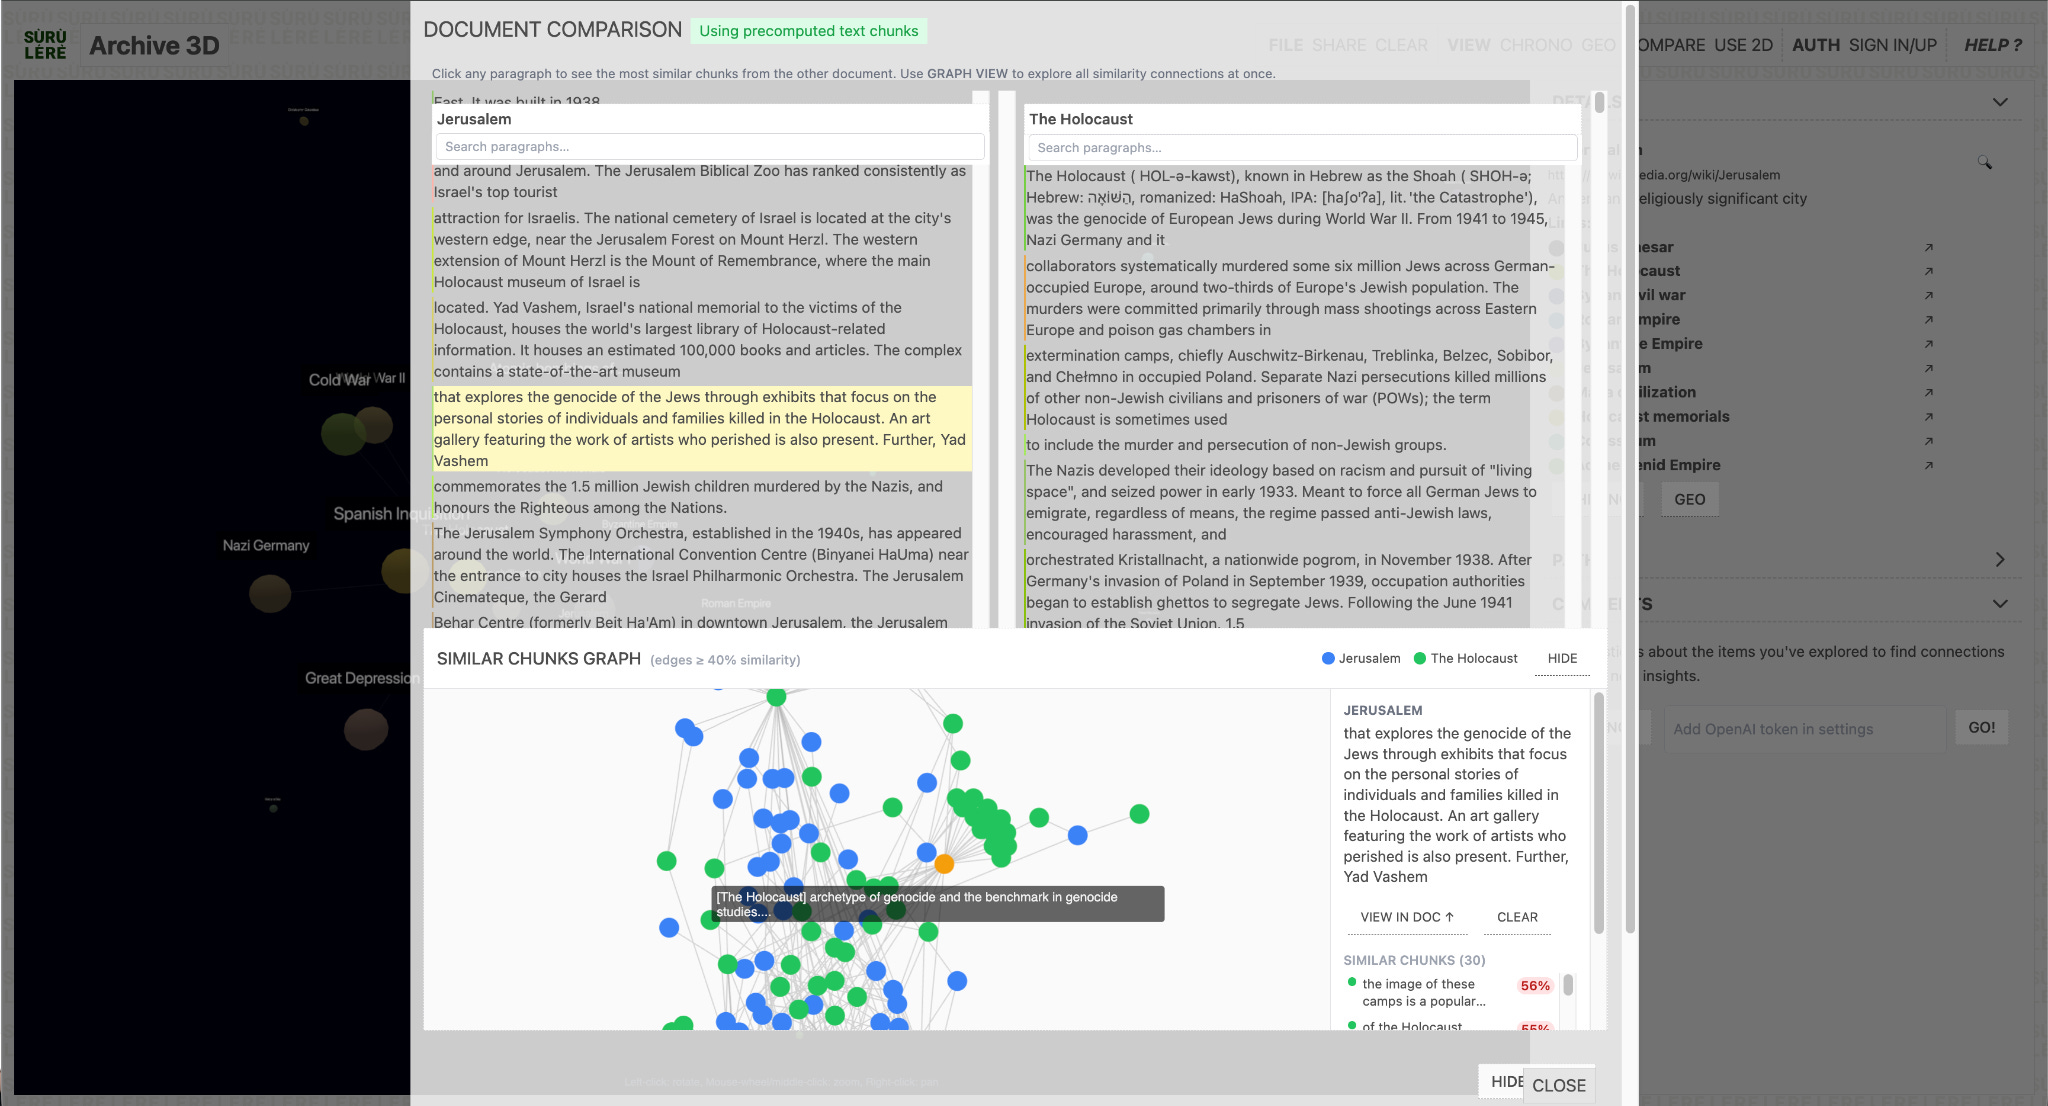
LLMs will increasingly get better at completion, summaries and synthesis to the extent of “eating” the whole interpretability problem. But I figure good scaffolding will be useful nonetheless, if not for human understanding of texts, then for visibility into the LLMs’ reasoning process itself – I’d argue that this general opinion is shared by Claude Code, DSPy and other “harnesses” or frameworks for critical LLM-driven tasks. Indeed visualizing the raw encodings of named entities in text as are surfaced by RAG, could provide a bridge with which to think with LLMs, rather than have LLMs think for us.
The Technical What and How of Archive 3D
The Archive 3D tool is my personal case study of building a tool to solve this problem. Over the past 2 years, it has followed the path of the common approaches in the LLM space, starting with Retrieval-Augmented Generation (RAG), and now centering on tools to visualize and understand historical archives. To illustrate how my thinking developed as I steeped in the space of using LLMs for archival knowledge bases, I’ll walk through a few versions/iterations of this tool:

Version 0: Data Ingestion and RAG Foundation (Dec 2024 - Jan 2025)
This involved a basic RAG pipeline of generating word embedding across entire documents, in form links (HTML pages) and PDFs, from my Are.na archive. This involved transforming both document formats to Markdown, using markdownify and PyMuPDF4LLM (note that PDF parsing is notoriously complex) – tools that I identified after a bit of research on approaches, trading off accuracy/quality, cost (offline, open source approaches) and speed (assuming the user would initially need to bulk import their corpus, rather than index it incrementally).
From these markdown-ified archives, I passed these to a free open source model all-MiniLM-L6-v2 to generate embedding across the entire text — which made sense to cheaply/quickly generate embeddings, avoiding the cost of hosted LLMs. These embeddings and metadata from Are.na were then stored in a vector database called QDrant – which I picked for no better-informed reason than SEO, but coincidentally had a cool built-in graph visualization of the DB contents, allowing me to do some visual debugging and otherwise quickly get rolling to deploy the tool.
At this point, the goal was simply trying to set up a RAG on my data, so I wired together a CLI to query the vector store to answer questions using the document chunks. This was a fun exercise, and upon showing it to my brother, we pointed it at some other datasets for his business research use case. This was great for showing the versatility of RAGs — but then something still felt lacking when exploring my archives without as clear of a research query, but more of an subjective goal of finding interesting connections to dig deeper into.
Version 1: 3D Graph Explorer + LLM Features (Apr - Jun 2025)
This version of the tool took a significant step in making the RAG query engine usable in a way that’s feasible to the discovery oriented approach to research with my archival practice. The 3D graph visualization was top of mind, so I quickly promoted my way to an interface here. Since this was a full fledged web app now and not only a CLI, I built something out using a standard web dev setup, using Netlify (my go-to PaaS, sorry Vercel) to deploy a React frontend app with some serverless functions to transit data back and forth from QDrant. I iterated to a seemingly useful flow of pre-loading random nodes, and having links progressively expand/reveal as a path is explored.
But, in the process of making UI tweaks on the baseline graph, it occurred to me that the old cut functionality could still be useful alongside the graph visualization. At this point, it was straightforward to plug the tool into an LLM API, and set up a simple chat interface to “chat with” the archives. In this case, there wasn’t much additional context engineering/harnessing to allow the LLM access the content of the RAG/knowledge graph itself, just a simple setup that passed the titles and links to relevant each node and assumed the LLM knew something about them. This constrained approach was driven by a limited context window, but worked well enough to start. Funny enough, in one of my first feedback sessions with a friend, he pointed out that I was giving free access to my LLM tokens with this chat view, which prompted me to have users set their own token in the frontend in order to use this feature (and trust that I would not store it for myself).
Version 2: Geographic and Chronological References (Jul - Sep 2025)
When the first solid foundations of the visual RAG tool were built, and I had a clear pipeline for indexing texts by semantic similarity based on word embeddings, the question of how else the text could be visualized came to mind. The subject matter of most of my archives had to do with historical texts, and I considered that visualizing the relevant locations and dates/time periods referenced was likely a powerful way to understand the texts, especially in relation to one another. The timeline visualization was heavily inspired by TimelineCurator from UBC and TimelineJS from Northwestern University, which were designed to serve researchers and journalists trying to understand and present chronological narratives. The map visualization also draws on my long-time interest in Geographical Information Systems (GIS), with writing about Mapping Lagos Slums and building a simple shareable map visualization tool. Thinking about examples of archival texts like Winston Churchill’s campaigns in the Sudan or Flora Shaw’s chronicles of British colonial Sudan and Nigeria, we see how these could be mapped and charted even against other major world events like the abolition of the slave trade, late 19th century European conflict, the Berlin conference and the first world war.
Implementation-wise, I utilized spaCy NLP toolkit for basic named entity extraction (NER) to identify location-type of date-type references in text. I then passed these to a geocoder API, to convert location strings to coordinates/regions to place on a map, and a hand-rolled temporal expression normalizer, to convert date strings to numeric timestamps/ranges to place on a timeline. The API-based geocoder approach was slow given network calls and also overkill given that I did not really need address-level resolution (only city and country), so I looked for and inevitably hand-rolled (mostly hand-prompted) an offline geocoder that utilized a local copy of GeoNames dataset to resolve the locations – I nerdsniped myself setting up an embedding-based resolver for ambiguous locations that resolved to duplicate names, though it was not as accurate as would be ideal (“Paris” might still resolve to “Paris, TX” in an article about Napoleon 🤦). For temporal expression normalization, I used a heavy mix of Regular Expressions to detect and normalize certain types of expressions that show up in historical texts, like the “Middle Ages” or the “Renaissance” – through this, I’ve learned that this is still a broad area of research in NLP, especially when it comes to doing it cheaply and in a comprehensive way that doesn’t require walls of parsing rules. Recently, I’ve spent a bunch of time researching and benchmarking approaches to temporal expression normalization, from rules- and constraint-based to LLM-assisted approaches, and found a 20-year old constraint-based approach called Temporal Expression Anchoring (TEA) to be promisingly fast, cheap and extensible – I plan to publish this survey as a paper for the wider research approach.
Version 3: Chunk-level Similarity & Advanced Visualization (Dec 2025 - Feb 2026)
After some time off, I went further on the emergent need for more granularity in exploratory analysis of the archives, by comparing texts via the constituent sections, sentences or paragraphs (considered “chunks” in the RAG context). The idea here is that we might see two linked nodes (articles/papers) in the graph, and decide we’d want to see what in particular is similar about these articles, maybe in that they reference the same time period (e.g. “History of Britain” and “History of Japan” articles both having a “World War II” section, or “U.S. Presidents” and “Hollywood History” both having paragraphs or more on “Ronald Reagan”)
This involved doing another round of indexing to chunk the text, using standard document chunking approaches provided by langchain_text_splitters library. I did a bit of initial iteration to figure out good defaults for chunk length/overlap that would be intelligible when visualized, and also useful from an embedding-based similarity mapping perspective. I arrived at roughly sentence-length chunks to start, although subsequent use of the tool shows that a configuration closer to paragraph-length would be more intelligible. The UI then visualizes the document by chunk, as well as maps similar chunks on another node-graph visualization.
Additionally, I did some parallelization of expensive operations to enable more scalable and sufficiently low-latency for onboarding users by bulk-importing their archives, using some green-thread based parallelism in Python given the low intensity of the tasks and relative ease of that approach. The infra engineer in me briefly considered a Celery setup for proper async/scheduled/background processing of bulk imported archives (perhaps a legitimate usability unlock, yet for non-existent users) … until I saw how much managed Redis costs on Google Cloud. This was a fun constraint that further drove parallelization work, and raised some other interesting (yet likely overkill) alternative approaches like HTTP event streams or WebSockets for loading indicators. Also, upon thinking more about the usability, I added a catalog/menu view to search through the archives and load nodes into the active view, all behind some authentication-gating powered by Supabase.
Future Versions: Offline-first, Modularity and Deeper NLP
I’ve taken some learnings from earlier phases of this tool, a few of them from user feedback (though I’m still the primary user) and others from technical factors. I’m taking this combination of my personal insights in developing and using the tool and some feedback from a few folks, and combining it with the recent zeitgeist around LLM + local markdown-driven “personal knowledge bases”, modular agent-friendly toolkits, as well as the movement around local-first software. I’d like to do as much processing locally as possible, storing the downloaded and converted archives as Markdown, such that users have more ownership/access to these. Additionally, the indexed semantic embeddings, chronological and geographic references can also be serialized locally, using files on disk in native formats like GeoJSON/KML spatial data, TIMEX-annotated text, as well as in SQLite database files with support for vector-embedding indexes and queries (i.e. nearest neighbor).
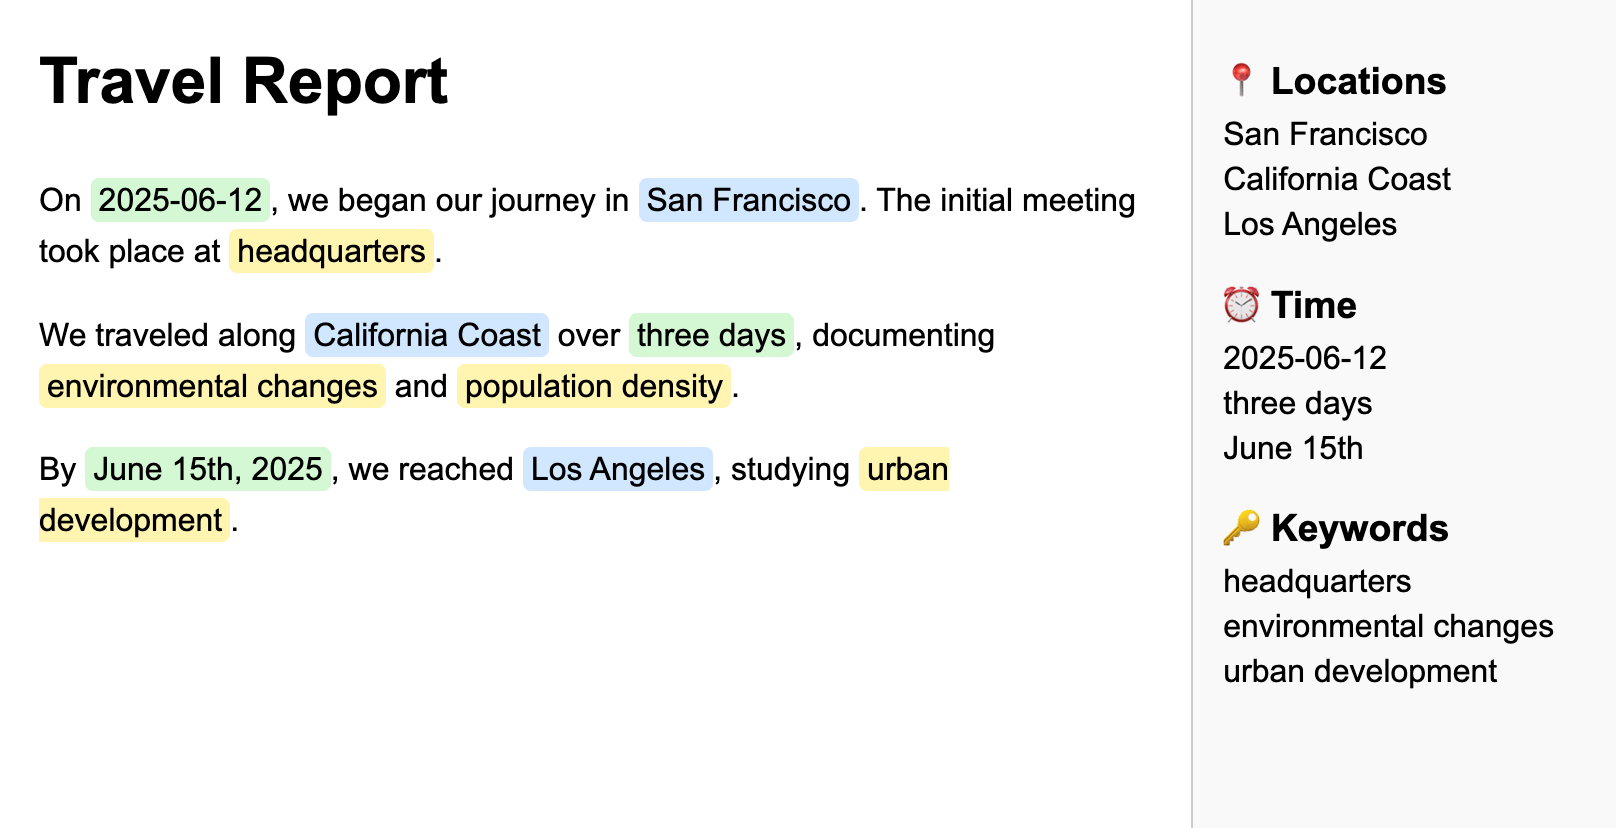
Additionally, there’s a clear need for more in-depth leveraging of diverse ideas from NLP, including named entity recognition (NER), to provide more points/layers/frames of reference, all of which can be queried/mapped visually in relation to one another, as well as fed into LLM context-windows. NER is the backbone of keyword identification as well as temporal/chronological reference extraction. Alongside extraction of key references in text, better semantic and structure-aware chunking of text would be crucial to the user journey of “zooming in” to discover related segments between two similar articles/papers/books. NER pipelines and such features for understandability of text are well implemented in OG NLP libraries like spaCy and, combined with embedding-based similarity and smart querying via LLMs, these can serve to super-charge the understandability of texts.
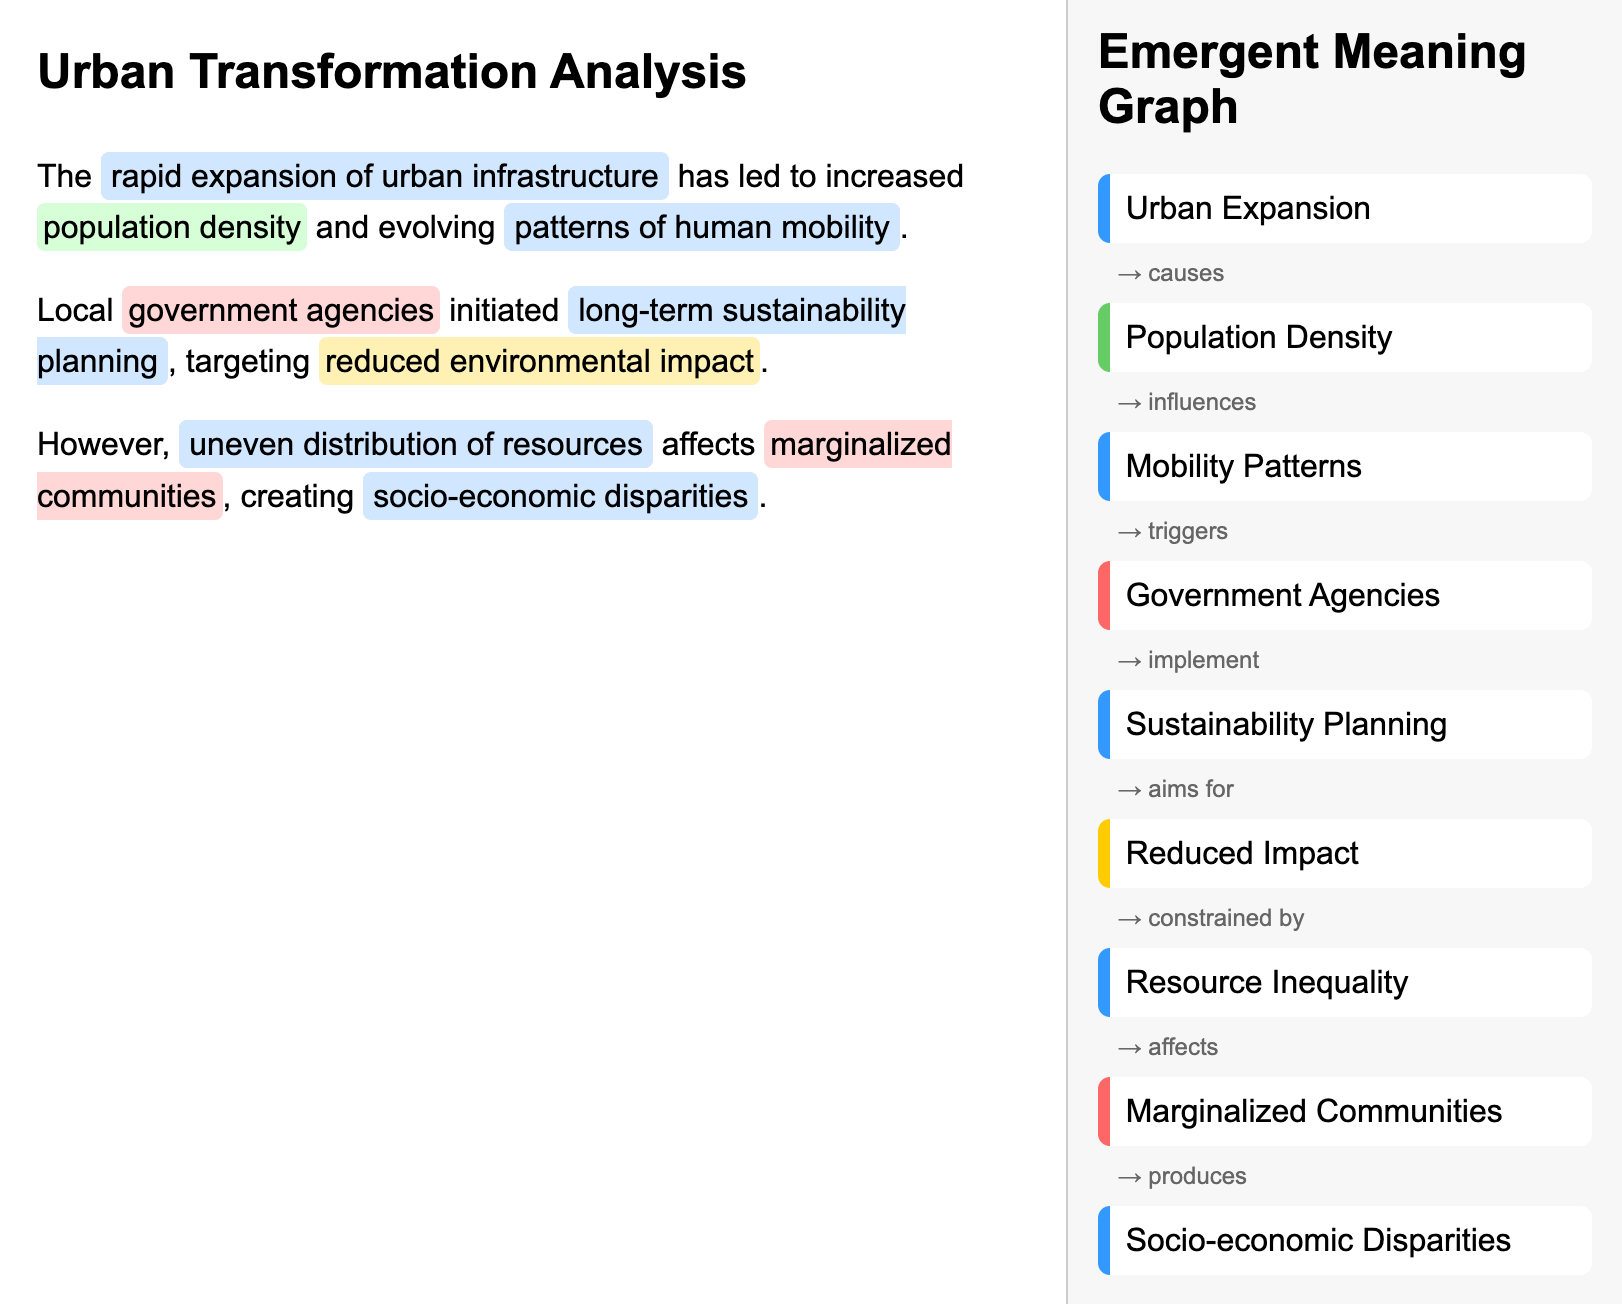
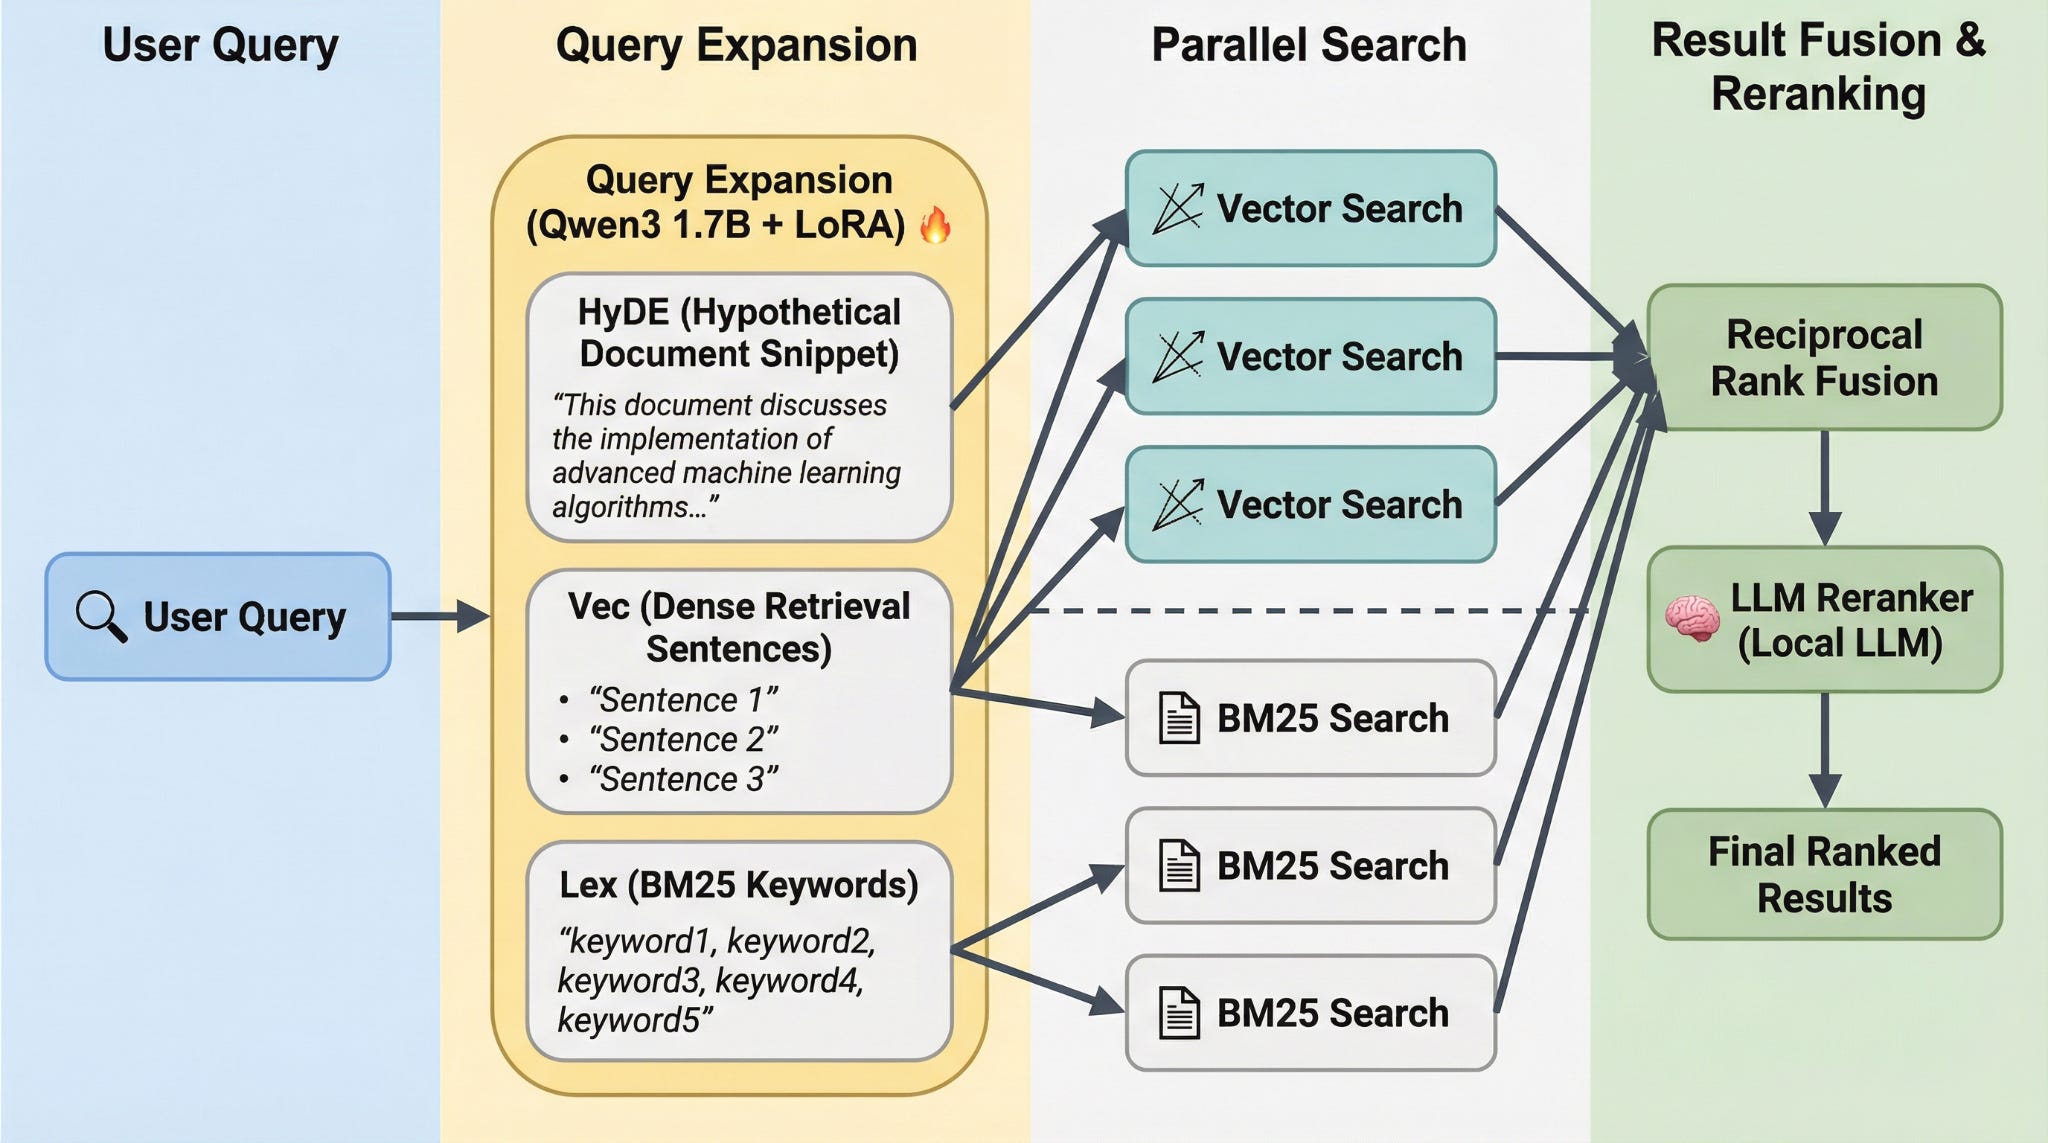
Recognizing the wider space of similar tools and push to agent-friendly modularity with LLMs, exemplified in Karpathy’s LLM knowledge base and Tobi Lutke’s QMD markdown indexing and RAG engine, I’m motivated to create modular components for individual tasks in this tool. This looks like a distinct CLIs for extracting geographical and chronological references, as well as a configurable means to chunk and index embeddings of texts, all relying on transparent plaintext data formats. One nice side effect of CLI-driven and plaintext/SQLite file-based storage of this data, is that LLM coding agents can assist in rapid experimentation, understanding and visualization of the semantic data along the stated reference frames as well as others that might emerge. This data can then feed back into query expansion and document search to further enrich results and LLM responses in a RAG system.
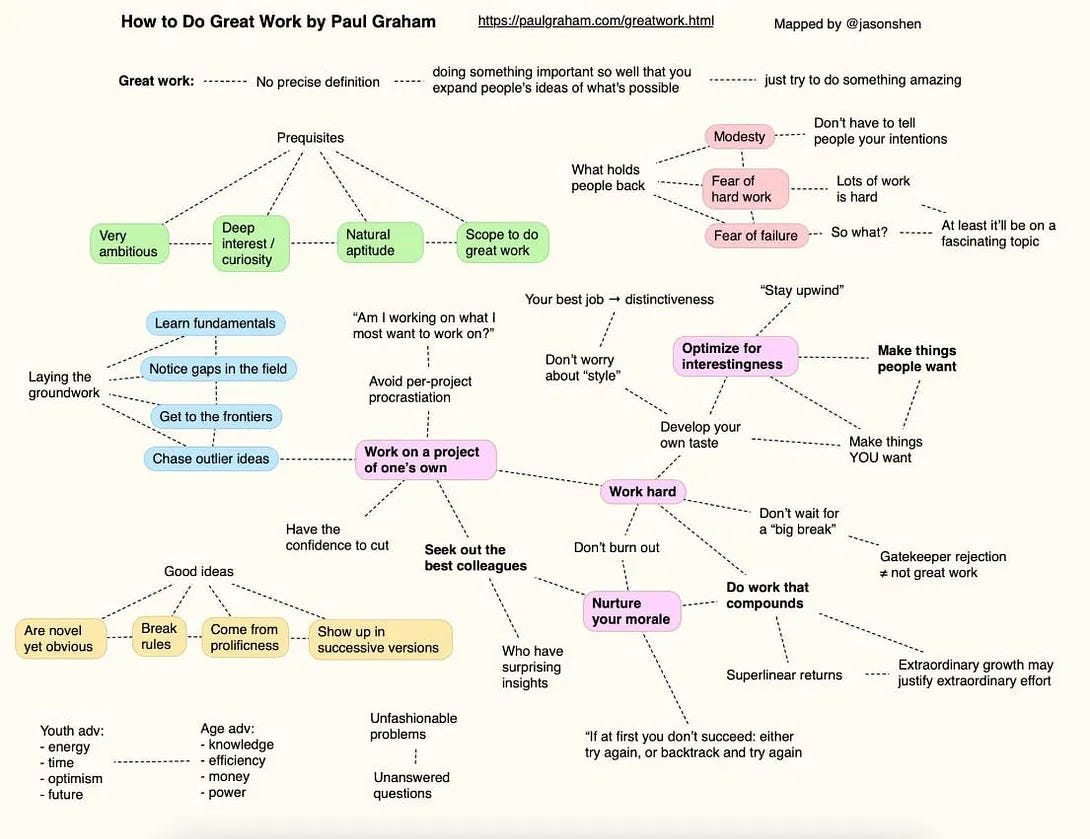
One quirky idea I’m playing with (please don’t steal this :p) is to generate quick “visual abstracts” of articles or text, as a way to “condense” and summarize articles/texts. Such means of summarizing information in non-textual formats are useful for visual learners like myself, and add an overall richness/aliveness to documents that might be otherwise dense or academic. These additional signals in a knowledge base tool can serve to help users build genuine understanding of archival information, and (crucially) ask new questions out of left-field rather than only provide a flat probabilistically “compiled” summary/answer from narrowed latent space.
Beyond the Experiment: Our Need to Understand the Archives
Speaking personally, the need to understand the archives in this way feels more pertinent as we narrow in on topics that are of particular interest to the long-term goals of the Surulere.dev project. As might be apparent through our archives and past blog posts, these goals include:
Understanding knowledge and symbolic systems that have supported civilization in Africa over the past millennia
Permaculture systems and interventions that can mitigate effects of climate change while empowering communities
Decentralized financial instruments for mitigating poverty and providing on-ramps to wealth-building in volatile developing economies
Each of these goals requires research, examining papers or articles with narratives that are argued alongside data in the form of images, maps or financial charts. These narratives inevitably sit in a broader context of data, information and narratives through history, where other data points provide angles with which to look at specific data. Consider the data points about insecurity in Northern Nigeria, which on the face of it is a result of religious extremism, when charted against climate change factors like the drying of Lake Chad and the consequent agricultural and economic effects – such realizations can be understood granularly, not just intuited, with tools that map and project narrative information with structured data on universal reference frames of chronology and geography, as well as semantic relationships and quantitative value.
As I dig deeper and connect with others to solve these distinct-yet-linked problem spaces, I’m intentionally framing the unique value that technology can bring to these. Indeed, there’s a variety of tools that will help in navigating these problem spaces, including interactive archival indexes, knowledge graphs, temporal mappers and geographic information systems. Through working on prototypes of these, it’s been exciting to make incremental improvements based on the feedback this has received. Still, I’m eager to go much further/deeper, in seeing how these tools can be useful to anthropologists, archaeologists, economists, policy makers, engineers and entrepreneurs – being some archetypes of collaborators with whom the above goals can be accomplished.
In all this, I’m careful to think about the pitfalls of building complex tools or systems around an ill-framed problem, in lieu of establishing a detailed knowledge/understanding of the problem domain. The counter-balance here is that, I am a computer scientist and tool-builder at heart, as opposed to an expert in any of the specific tools or areas of interest that I’ve mentioned here, and the value that I can concretely bring here is to support subject matter experts with appropriate tools, and bridge different domains as a generalist enthusiast & researcher. Recognizing this, it feels like the ideal approach is a deeply collaborative one around which tools might be needed.
So, to readers in my network, consider this essay to be a technical overview and a call to action with two arms:
Types of research and archival information that is available to be parsed towards the goals, and the sorts of insights that can arise through tools for multi-dimensional comparative analysis
Examples of interventions, especially in the context of Nigeria/Africa, that are possible when supported by such evidence: e.g. outlining politicians historical campaign promises, or mapping floods and other natural or infrastructural disasters
I hope this post serves as a clarion call to the wider network of enthusiasts and experts, to bring together such technology and experts aligned towards similar goals.